Reverse Engineering Bing Streetside
I’ve previously reverse engineered Google Street View, So the next logical step was to reverse engineer Microsoft’s Bing Streetside. You probably didn’t know Bing Maps has its own version of Google Street View, but they do. By the end of this article, Bing Streetside will have been sliced, diced, and glued back together.
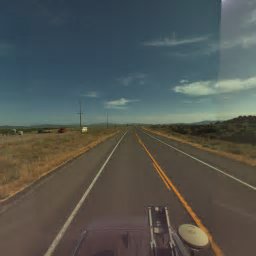
But first, a bit of detail on how these street view systems typically work. A location is photographed from multiple angles and these photos are then stitched together to make a sphere of images. Like a map of the Earth, this sphere must be projected to be represented with a flat image. These flat 360° images are then broken up into tiles so that you’re browser can download and render only the part of the sphere your looking at, saving bandwidth. To further save bandwidth, each tile has lower resolution ‘zoom levels’ which are displayed when you are zoomed on a section of an image.
I’m particularly interested in how the web browser obtains these images and their tiles. Google Street View’s system is simple, your browser requests the tile for an x and y position at a specific zoom level, and you are returned the tile image. When I first looked at Bing Street View I was expecting the same system, but was surprised to see much more complexity.
In this article, I will analyze, rebuild, and explain Bing Streetside’s complicated system for requesting tiles.
Reconnaissance
Getting into Bing Streetside is fairly simple. Just zoom into a bit of road and then click on the road.
In the map view, the URL is
https://www.bing.com/maps?cp=37.967882%7E-122.519459&lvl=20.0&style=g
Jumping into Streetside view changes the URL to
https://www.bing.com/maps?cp=37.967882%7E-122.519459&lvl=20.0&style=x
The only change is the style parameter going from =g to =x
Manually changing the URL back to style=g brings back the map view, and changing it back again to style=x brings back the street side.
From this information, the following can be concluded.
style=x indicates that a bing maps URL is in Streetside view.
The URL encodes all the information needed to obtain the Streetside imagery.
Pokin’ around
But that doesn’t give us much information on how to get the image tiles, so into the browser devtools we go! Flipping over to the network tab and with a quick reload, a waterfall of requests appear.
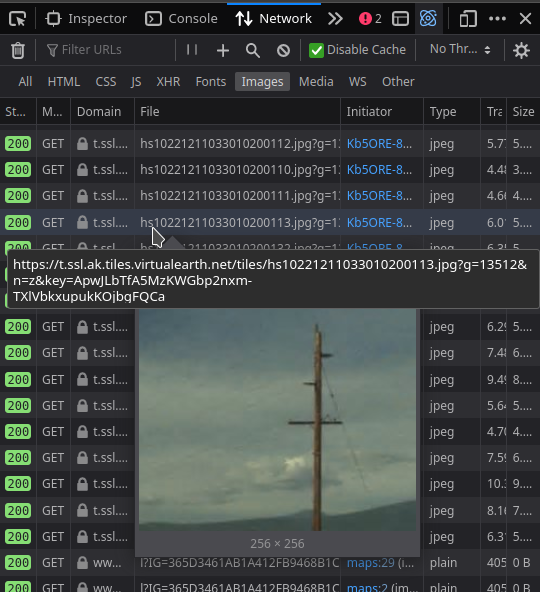
Sorting by image, we see URLs like this one:
https://t.ssl.ak.tiles.virtualearth.net/tiles/hs10221211033010200113.jpg?g=0
This is one of the tiles which makes up the greater image. I’ve removed all the unnecessary stuff from this URL, leaving only the essential parameters needed to get a tile. Looking at another tile in the network view:
https://t.ssl.ak.tiles.virtualearth.net/tiles/hs10221211033010200112.jpg?g=0
This tile is just to the left of the previous one
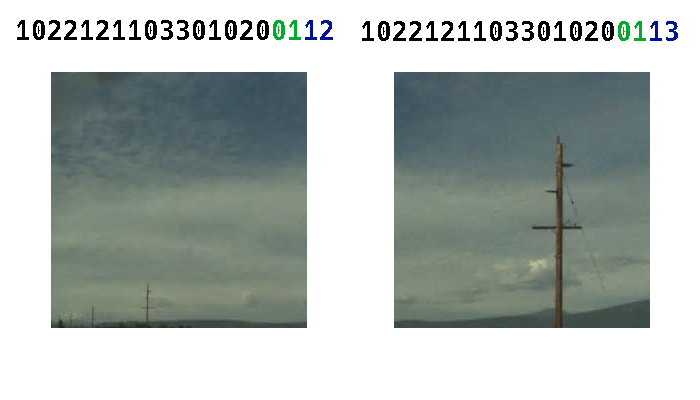
I’ve labeled each tile with the ‘mystery number’ from its filename. I’ve also highlighted certain digits of this URL number, but I’ll get back to those later.
Looking at some more tiles in the network requests, we can assemble a full square:
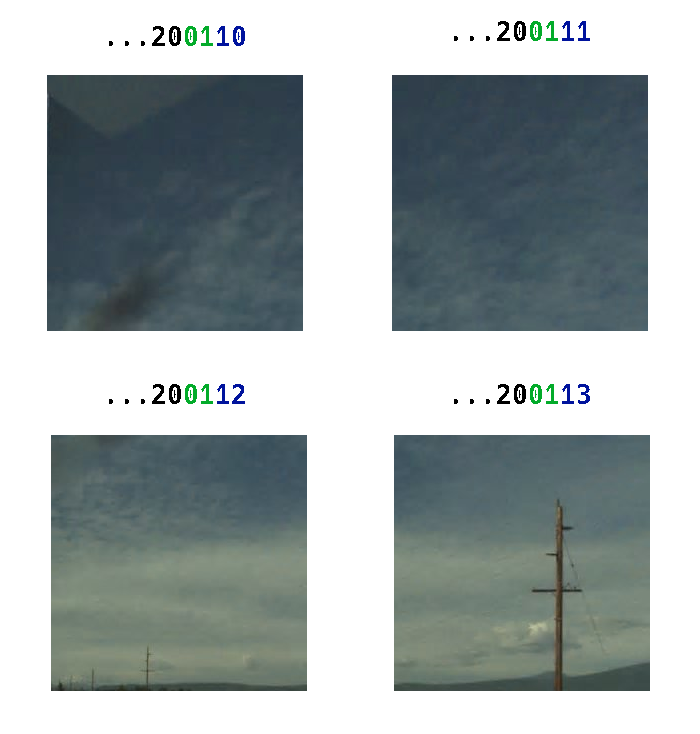
The first handful of digits are the same between these tile, so I’ve chopped them off. Notice that the the top left tile’s URL number ends with 0, the top right with 1, the bottom left with 2, and the bottom right with 3. Interestingly, if we bump this number up to 4 and make the request, we get back a “Bad Request” error. In fact, no tile id can have any digit greater than 3 in it without getting a “Bad Request” error.
At this point, we still don’t have a clear picture of how this system works. It doesn’t appear to be using an X, Y grid to arrange the tiles. A grid like that would require two values, but the tile only has the single URL number, so back into the network requests we go. Looking through all the tiles, one of interest shows up.
https://t.ssl.ak.tiles.virtualearth.net/tiles/hs1022121103301020011.jpg?g=0
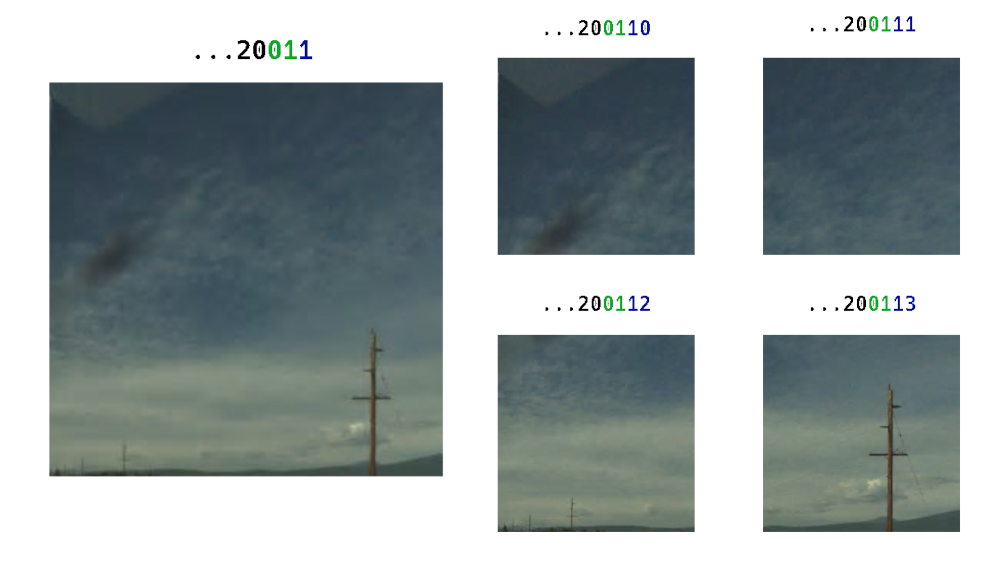
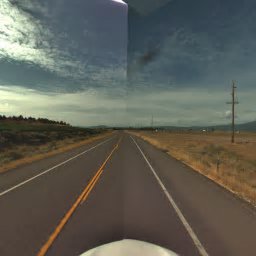
This tile is a zoomed out version of the previous four combined. This ‘zooming out’ is denoted by the id number by having one less digit. Each of the previous four tiles we looked at has 20 digits, but this one has 19. Removing another digit from the end of the id number gives an even more zoomed out, and even lower detail, image. The minimum amount of digits, and thus the furthest out zoom is 18 digits. Here’s what the lowest zoom looks like
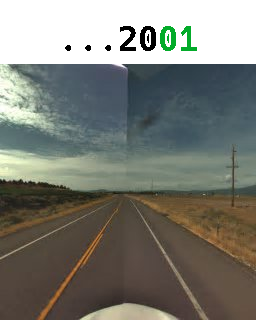
But not only can we zoom out, we can also zoom in. By bringing the tile id to 21 digits, we reach the maximum zoom.
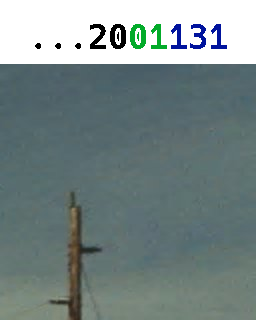
Back to the minimum zoom though. Fiddling with the (green) 17th and 18th digits will change where the tile is facing: front, right, back, left, top, and bottom. This arrangement of six faces of a cube is known as a cubemap projection.
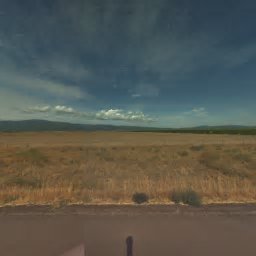

Messing with all digits through 16 will move the image to a completely different location, meaning that the first sixteen digits are a sort of real world location id, and the rest are tile positions.
At this point, we can break down the URL number into three parts

Digits 1–16 are the image ID and represent the real world location of the image.
The following two digits, digits 17 and 18, represent a specific face on the cubemap projection.
Additionally, up to three more digits can be added to the end to specify the position of a tile within the face represented previously. For each additional digit specified, the tile will represent a smaller and smaller portion of the cube face.
There is something odd about the URL numbers. They don’t include any digit greater than three. In fact, requesting a tile with a URL that contains a digit of 4 or more will return a “bad request” error. It turns out that Bing uses the base-4 number system for these ids. Base-4, or quaternary as it is known, does not come naturally to me, so I’ve made a table showing a few numbers in common bases.
| Quaternary | Binary | Decimal |
|---|---|---|
| 00 | 000 | 0 |
| 01 | 001 | 1 |
| 02 | 010 | 2 |
| 03 | 011 | 3 |
| 10 | 100 | 4 |
| 11 | 101 | 5 |
| 12 | 110 | 6 |
Later in this article I’ll get into why they chose quaternary as a number system, but for now, let’s get back to the tile position value in the URL number.
Deciphering the position value
The Position and Zoom are intertwined. Adding digits to the end of the position increases how zoomed into a spot it is, up to three digits. Because the Position value is only one number, the tile position can’t be encoded as a simple X Y position. Another idea could be that the tiles are sequential. Tile No.1 is next to No.2 is next to No.3 and so on, eventually wrapping to the next row. As we found out earlier however, incrementing through four tiles will make a square of tiles, not a row.
I was stumped with this issue for a while. Trying to figure out how these images were arranged, I downloaded a bunch of tiles at random, manually arranged them, and tried to see if there was any sense to it. Each tile is labeled with its cube face value and position value.
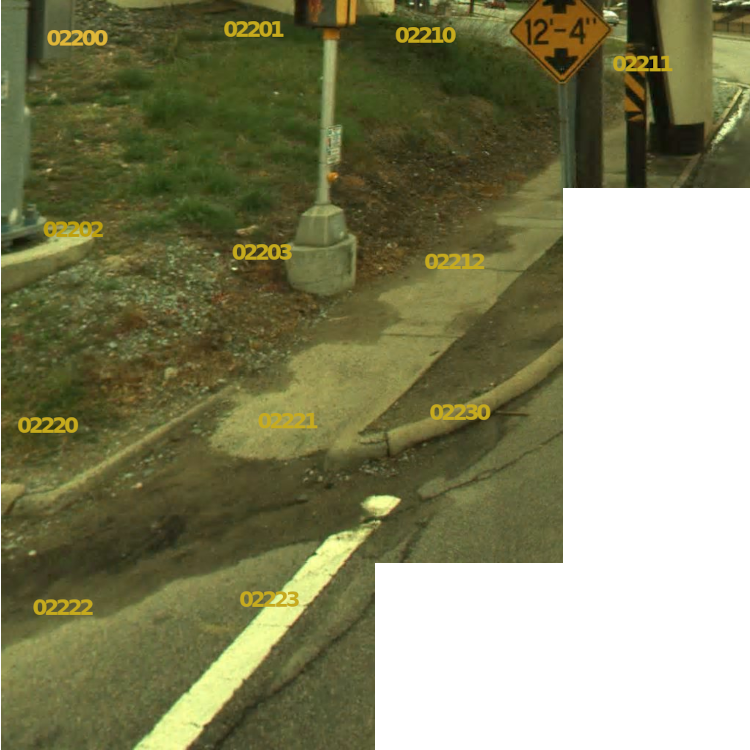
But all I could glean from this is that the tiles are arranged in a sort of nested squares, and I couldn’t find a way to make a function that would take the position value and return an x and a y.
So I forgot about it for a few months.
One day I was talking with a friend about the Hilbert Curve, a method for mapping the number line onto the entirety of two dimensional space. Immediately I thought back to Bing.
Excited with the prospects that I’d cracked the code and that the tiles were laid out using a hilbert curve, I loaded up the months old image and started connecting the tiles with lines (I’m not sure why I didn’t do this earlier).
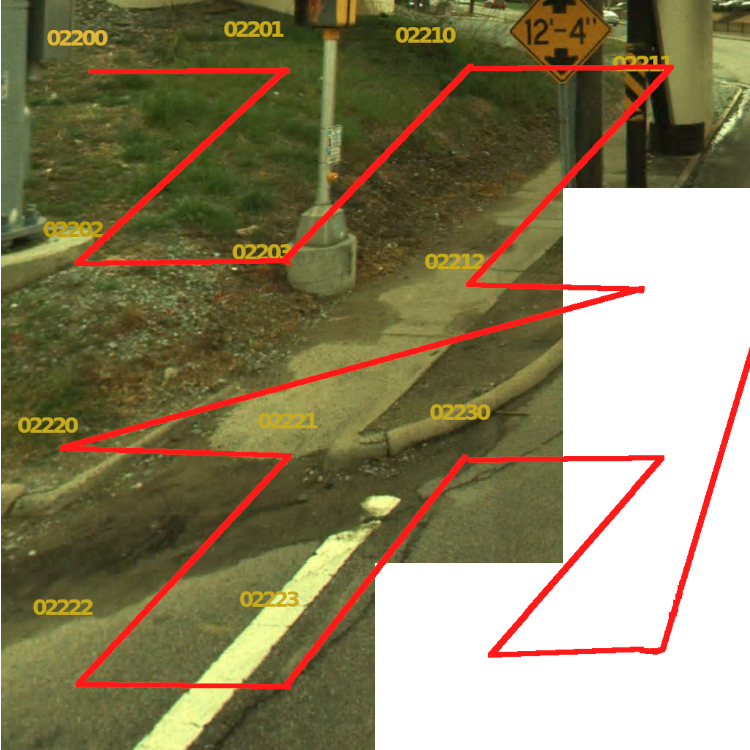
To my disappointment, Bing does not use the Hilbert Curve, but rather another in the category of space-filling curves, the Z-order curve!
The quadtree and the Z-order curve
But after some digging, and a rabbit hole later, it turns out that the Z-order curve is not very helpful in understanding the position value. Thinking of the position value as a location within a Quadtree is more intuitive. A quadtree is a tree structure where each node has four children or no children. That explanation is not very insightful so I’ve prepared a visual demonstration of how the quadtree relates to these position values.
Thinking of the position value directly as a number is a bit misleading as to how it is used, so instead let’s think of each digit as an instruction, A, B, C, or D instead of 0, 1, 2, or 3. The position value 103 would be BAD. Each digit, or character, from left to right, is an instruction on how to navigate the quadtree.
Starting at the root of the tree — marked with an “I” — we draw an axis and label each of the quadrants. The first instruction, B moves us down into the B quadrant, and the B node of the tree.

In the B quadrant, we once draw another axis centered around B and label the sub-quadrants. The next instruction is an A so we move into the A sub-quadrant of B, or the BA node of the tree.

The final instruction is D so we descend into the BAD node.

There are no further instructions so this is where the position value resolves to. It may not be immediately clear how this yields an X Y position so here’s a zoomed out version:

And with grid lines drawn to the size of the smallest sub-quadrant:

It is now clear that this process of repeated dividing in quarters has created an X Y grid. The instructions BAD or 103 have led to the X Y coordinates (6,2). If you’re familiar to the mathematical idea of limits this should feel familiar. Each additional instruction will bring the position closer and closer to a converging value.
I hope it now is starting to make sense why the position values (and by relation the image IDs) are encoded in quaternary. Each digit acts as an instruction to one of the four quadrants. Converting the previous example of BAD into quaternary gives the position value 103. We didn’t have to use the Z-order curve to get the X Y position. The Z-order curve can be thought of as a byproduct of the quadtree.
One additional thing to note is that each instruction doubles both the width and height of the X Y grid. This can be simplified to where w is the width in tiles of the grid and n is the amount of instructions. Given that the position values have three digits at their highest quality, we can determine that each face has a width and height of 8 by 8.
Getting image IDs from location
At this point getting the image ID requires going into the devtools and searching for it manually. The Bing Maps web application is able to convert the following URL to an image ID just from the latitude and longitude.
https://www.bing.com/maps?cp=37.967795%7E-122.519632&lvl=22.0&style=x
Wanting to figure out how it does that I opened devtools and went back to the network tab. Searching for “streetside”, one URL of interest showed up:
https://t.ssl.ak.tiles.virtualearth.net/tiles/cmd/StreetSideBubbleMetaData
?count=500
&north=37.968244964002885
&south=37.96734503599712
&east=-122.51918203599712
&west=-122.52008196400288
Which returns this JSON data.
[
  { "elapsed": 0.0137299 },

  {
    "id": 1357516517, // Image ID
    "la": 37.967843, // Latitude
    "lo": -122.519645, // Longitude

    // . . .

    "cd": "5/14/2022 11:31:02 AM" // Capture Date
  }

  // . . .
]
This URL queries for a list of nearby Streetside images, and some related metadata. The URL parameters north south east, and west are the area to search for Streetside images, and count is how many to return. In the JSON data, there is an “id” which appears like it may be the image ID, but all the image IDs are in quaternary as seen before. It turns out that this query returns the ID as the decimal “1357518537”, and must be converted to quaternary “1100322201123021”.
This StreetSideBubbleMetaData API endpoint solves the problem of getting image IDs from latitude and longitude. With this last piece of the puzzle, we can now build a program which can download the full resolution Bing Streetside images.
Implementing an image downloader
Reconstructing Bing Streetside can be broken up into four parts. First, the image ID must be found from the geographic coordinates. Then, all cube face tiles must be downloaded. Finally, all tiles can be stitched together into faces and into the cubemap projected image. I’ll be programming this implementation as a few NodeJS scripts because I’m familiar with the language.
Obtaining the ID
Given the information on the StreetSideBubbleMetaData API endpoint found earlier, I made this script to get an image ID given a latitude and longitude.
"use strict";
import fetch from "node-fetch";

async function main() {
  let lat = 37.769518;
  let lon = -122.412015;

  // Area area to search around position for query
  let range = 5 / 1000;
  // Quantity of streetside positions to query for.
  // We only are interested in the one closest to the latitude and longitude
  // so 1 will be fine.
  const count = 1;

  const formattedURL =
    `https://t.ssl.ak.tiles.virtualearth.net/tiles/cmd/StreetSideBubbleMetaData` +
    `?count=${count}` +
    `&north=${lat + range}&south=${lat - range}` +
    `&east=${lon + range}&west=${lon - range}`;

  // Send query
  const resp = await fetch(formattedURL);
  if (resp.status === 200) {
    const text = await resp.text();
    const parsed = JSON.parse(text);
    // Print id to standard output
    console.log(parsed[1]?.id);
  } else {
    console.log("Could not get ID", " Status: ", resp.status);
  }
}
main();
This script will output a decimal ID like the following one:
1248148552
Downloading
Downloading is a fairly simple. The decimal id is converted to base-4 and then each face and each tile on said faces are looped through. The quaternary image ID, cube face number, and tile position are formatted into the image tile URL format discussed earlier and then downloaded.
"use strict";
import { writeFile } from "fs/promises";
import fetch from "node-fetch";

async function main() {
  // SET BASE-10 ID HERE
  const id10 = 1248148552;

  // Convert Decimal ID to Quaternary
  const id4 = toBase(id10, 4);

  for (let face = 1; face <= 6; face++) {
    // Convert cube face number into quaternary and ensure it's two digits
    const face4 = toBase(face, 4).padStart(2, "0");

    // Loop though all 8×8=64 tiles.
    for (let position = 0; position < 64; position++) {
      // Convert position into quaternary and ensure it's three digits
      const position4 = toBase(position, 4).padStart(3, "0");
      // Format url with Image ID, Cube Face, and Tile Position, all in quaternary
      const url =
        `https://t.ssl.ak.tiles.virtualearth.net/tiles/` +
        `hs${id4}${face4}${position4}.jpg?g=0`;

      // Download tile
      const response = await fetch(url);
      const imageData = response.body;
      console.log("downloaded: ", url);

      // Save tile into out directory
      const filename = `out/${face4}${position4}.jpg`;
      await writeFile(filename, imageData);
    }
  }
}

main();
Stitching tiles
To stitch together the tiles I’ve used the node canvas library. For each face, all tiles are loaded and their position values are converted to X Y coordinates and then plopped on the canvas. After a face has been fully filled with tiles, it is saved to its own file. Finally, all the faces are loaded into the this script and stitched into the standard cubemap layout. This script is pretty long so I’ve cut out the boring parts. I’ve left the function “quadtreePositionToXY” which takes the position value instructions and converts them to X Y. It works by nudging the x y position by a smaller and smaller amount for each instruction. X and Y start at (0,0) and after each instruction are brought to the top left corner of the current node in the quadtree. After all instructions are exhausted, the X and Y values are returned.
// …
const WIDTH = 8;

function quadtreePositionToXY(position) {
  let x = 0;
  let y = 0;
  // Loop through each position value and treat it as an instruction.
  for (let j = 0; j < position.length; j++) {
    // The delta value is equal to the width of each tile at the current instruction depth.
    let delta = WIDTH / 2 ** (j + 1);
    switch (position[j]) {
      case "0":
        // Do nothing
        break;
      case "1":
        // Move right
        x = x + delta;
        break;
      case "2":
        // Move down
        y = y + delta;
        break;
      case "3":
        // Move down and right
        y = y + delta;
        x = x + delta;
        break;
    }
  }
  return [x, y];
}
It should be noted that the quadtree position can be more efficiently converted to XY coordinates if the quadtree is looked at as two interleaved binary trees, but that’s a bit more complicated and harder to visualize.

These three scripts make it possible to download and stitch Bing’s Streetside images into cubemaps. They are intended as a proof of concept for this reverse engineering effort. I don’t intend for them to be used to download images in bulk or anything like that. These scripts are too slow for that purpose anyhow.
The full unabridged source code is available at my git page.
Why Bing chose a complicated system
All this begs the question: “Why did Bing choose this complicated system?” While I don’t know the answer to this question, I’ve got a few guesses. First, quaternary may have been chosen as it simplifies the logic with quadtrees. As explained before, a quadtree is navigated with one of four instructions. A base 4 number system ensures that each digit will match to an instruction. But the major question still remains, “Why use quadtrees?” This is a much harder question and frankly, I don’t see any good reason. Theoretically they could use the quadtree to have variable levels of detail in tiles. For example, if some nodes in the tree went deeper than others, there could be a patchwork of detail levels instead of the uniform detail that bing uses. Another idea is that they take advantage of the quadtree structure when rendering the streetside image in the browser. After all, there are multiple detail levels so that your browser does not need to download the entire image. I imagine that the tree structure could be useful to implement the multiple detail level system, but I don’t have their source code, so I couldn’t say.
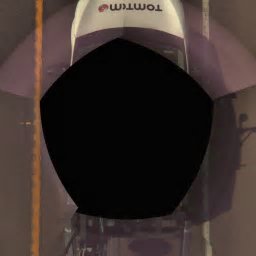
I’ve been questioning why Bing chose a very complex system but very well may have not been Bing that chose it. If you look down at the car in the streetside images, you will see tomtom on the hood. TomTom is a mapping company which Bing has partnered with to improve their maps. It seems to me that Bing is simply using TomTom’s images and also likely the system TomTom made for it.
I can think of some reasons why Bing would have used the quadtree structure, but none of them add enough value to warrant the added complexity the structure entails. For reference, Google Streetview uses the refreshingly simple idea of X, Y, and Zoom for requesting tiles. If I were to make one final guess as to why they chose a quadtree, it would be that some engineers thought it was cool and wanted to use it in a project.
I get this nagging feeling there’s something I missed and there truly is a great reason behind the technical decisions of Bing Streetside. If you have any insight that I may have missed, please shoot me an email.
Conclusion
Figuring out how this API worked was an interesting adventure. I thought it would be easy to download and stitch streetside images together but was met with new challenges. I hadn’t worked with quaternary, quadtrees, or space filling curves before and I stumbled a bit when figuring out how they work. After writing this article I found that Bing does have a public API for their streetside service. I didn’t need to reverse engineer how this worked, but I don’t think I would have learned as much if I simply used their documentation, and besides, I don’t really have a use for these streetview images. I just wanted to learn how a system worked.
